前言
前面的章节中,我们一步步走来,了解了图像的读取和输出,基本图形的绘制,图像的变换(平移、旋转、缩放)和文字的插入。在此基础上,今天我们终于可以写出第一个实用的画图程序——函数图像绘制。
原理
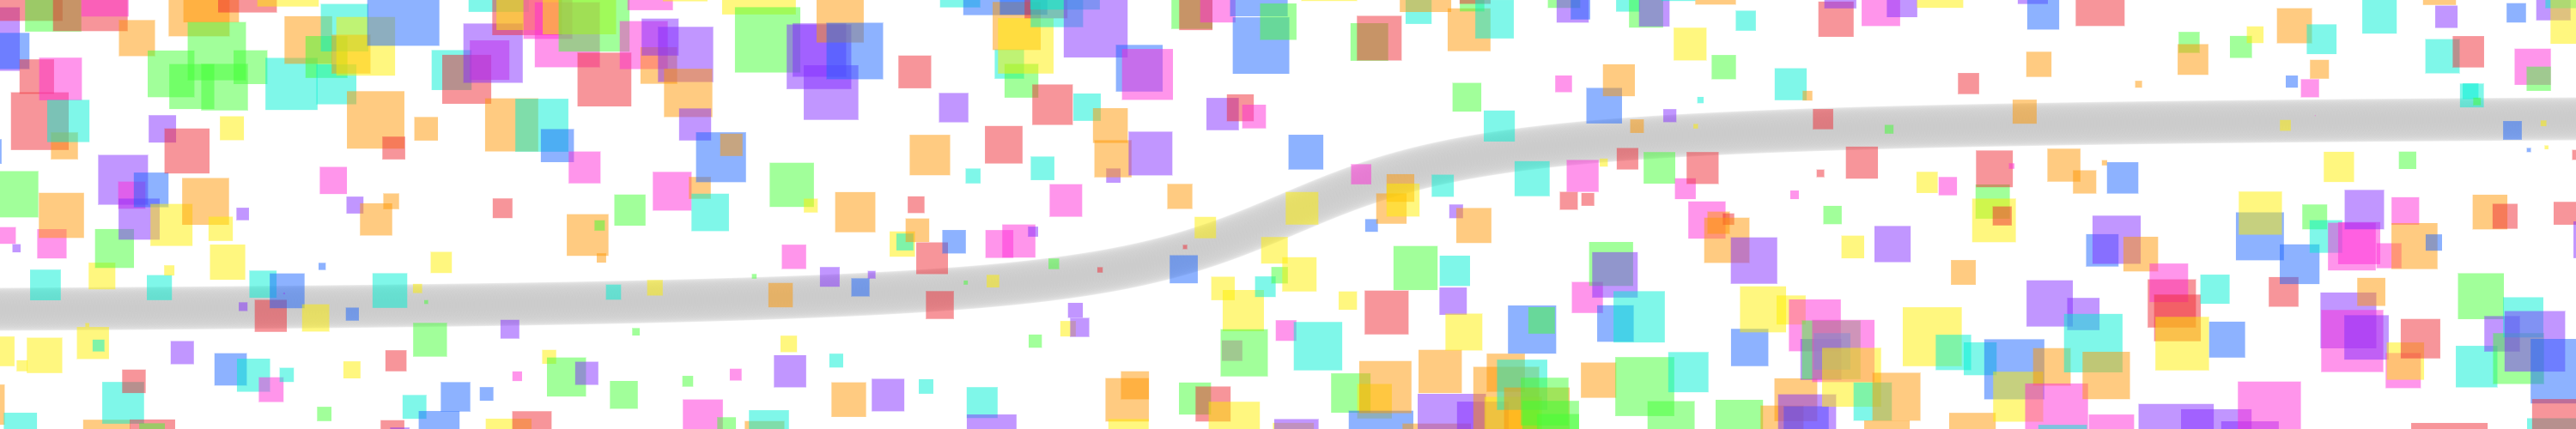
绘制函数图像,最简单的方法便是在原函数上取很多离散的点,再两两连线,绘制成折线图。当点取得足够密集时,图像看起来就是连续的。我们的函数图像绘制工具就是利用的这种方法,在相邻两点之间用胶囊体(Capsule)相连。
除了函数图像本身,最后生成的图片上还有一些其他的部分,比如标尺,刻度,标题,横纵轴的名字与单位等,这要求我们创建一个布局来给每个部分提供绘制的空间,最好可以由用户指定需要绘制哪些部件,布局也能够自适应地进行调整,不会出现空出未绘制部件的位置的情况。此外,还要考虑将图像有意义的部分保留,剔除空白的部分,即我们要根据函数的值域和定义域来确定函数的xy坐标与图片的像素坐标之间的对应关系,来使得最终函数图像区域能够集中绘制有意义的图像。
布局
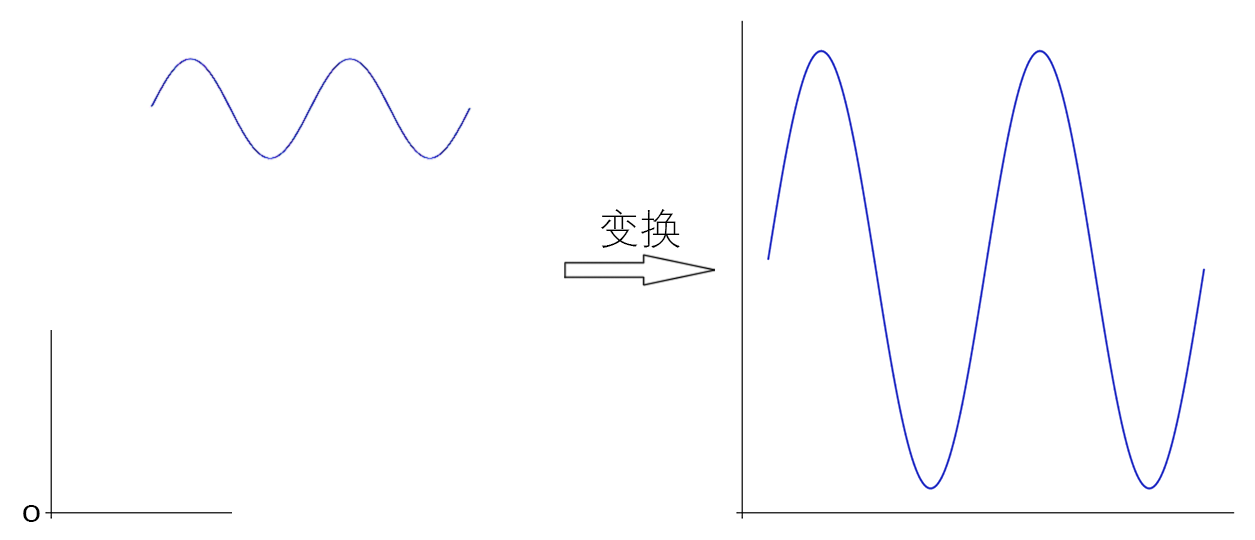
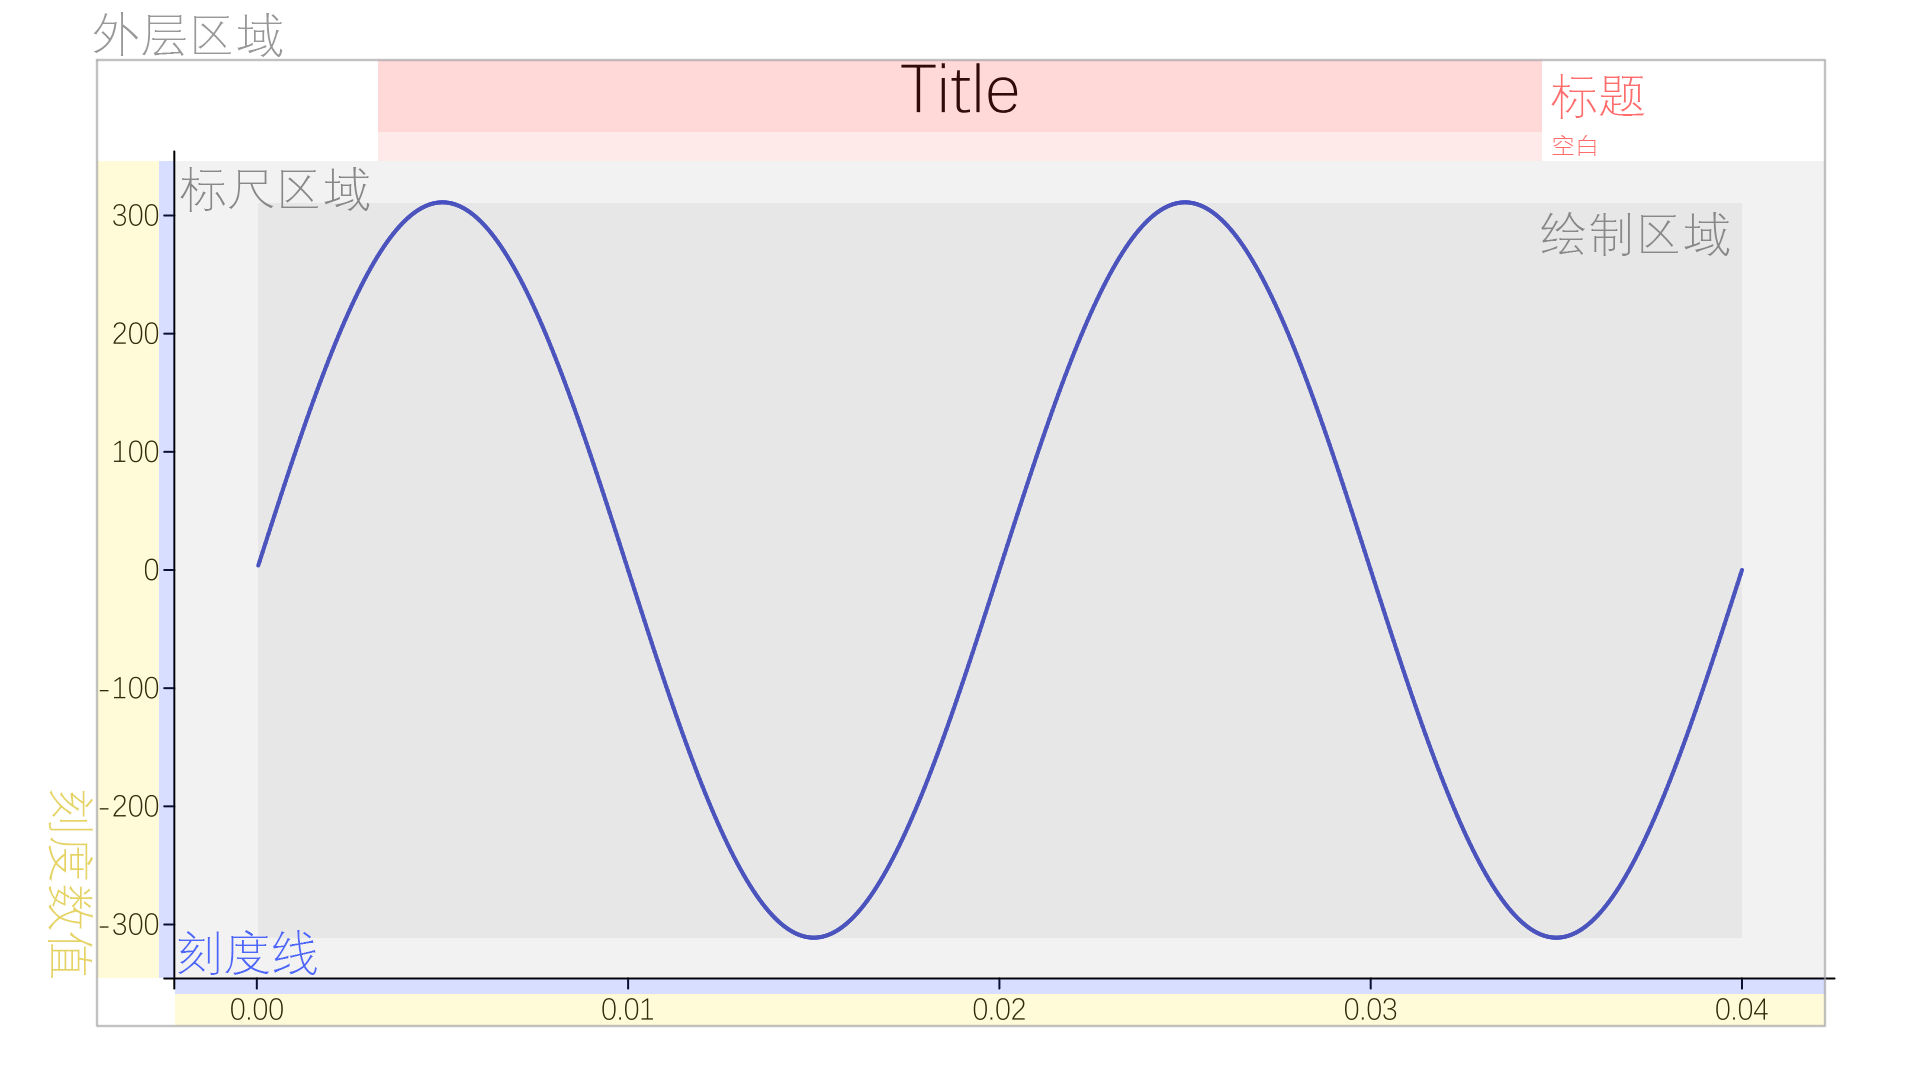
根据一般的函数图像绘制标准(例如Origin软件中的格式),绘图区域是一个矩形,标尺围绕着绘图区域的左边和下边,和绘图区域之间有一定的空白。标尺上朝外画着刻度,并标有数值,从此再往外是两个坐标轴的名称,它们与刻度数值之间有一定空白。从标尺区域往上是标题,中间也有空白。
由此,我们可以抽象出下面的布局图:
由于我们已经知道的是图片画布的大小,所以为了确定布局中每一块的位置,我们只能由外向内推导。
先确定外层区域的大小,这可以由画布的大小自定义推导得到,再计算出标题,横纵坐标名称,横纵坐标数值,横纵坐标刻度的宽度。需要注意的是,这些区域应该都是可选的,如果用户在外围不设置使用这些元素,我们应把它们的宽度设为0,这样就可以实现布局的自适应调整
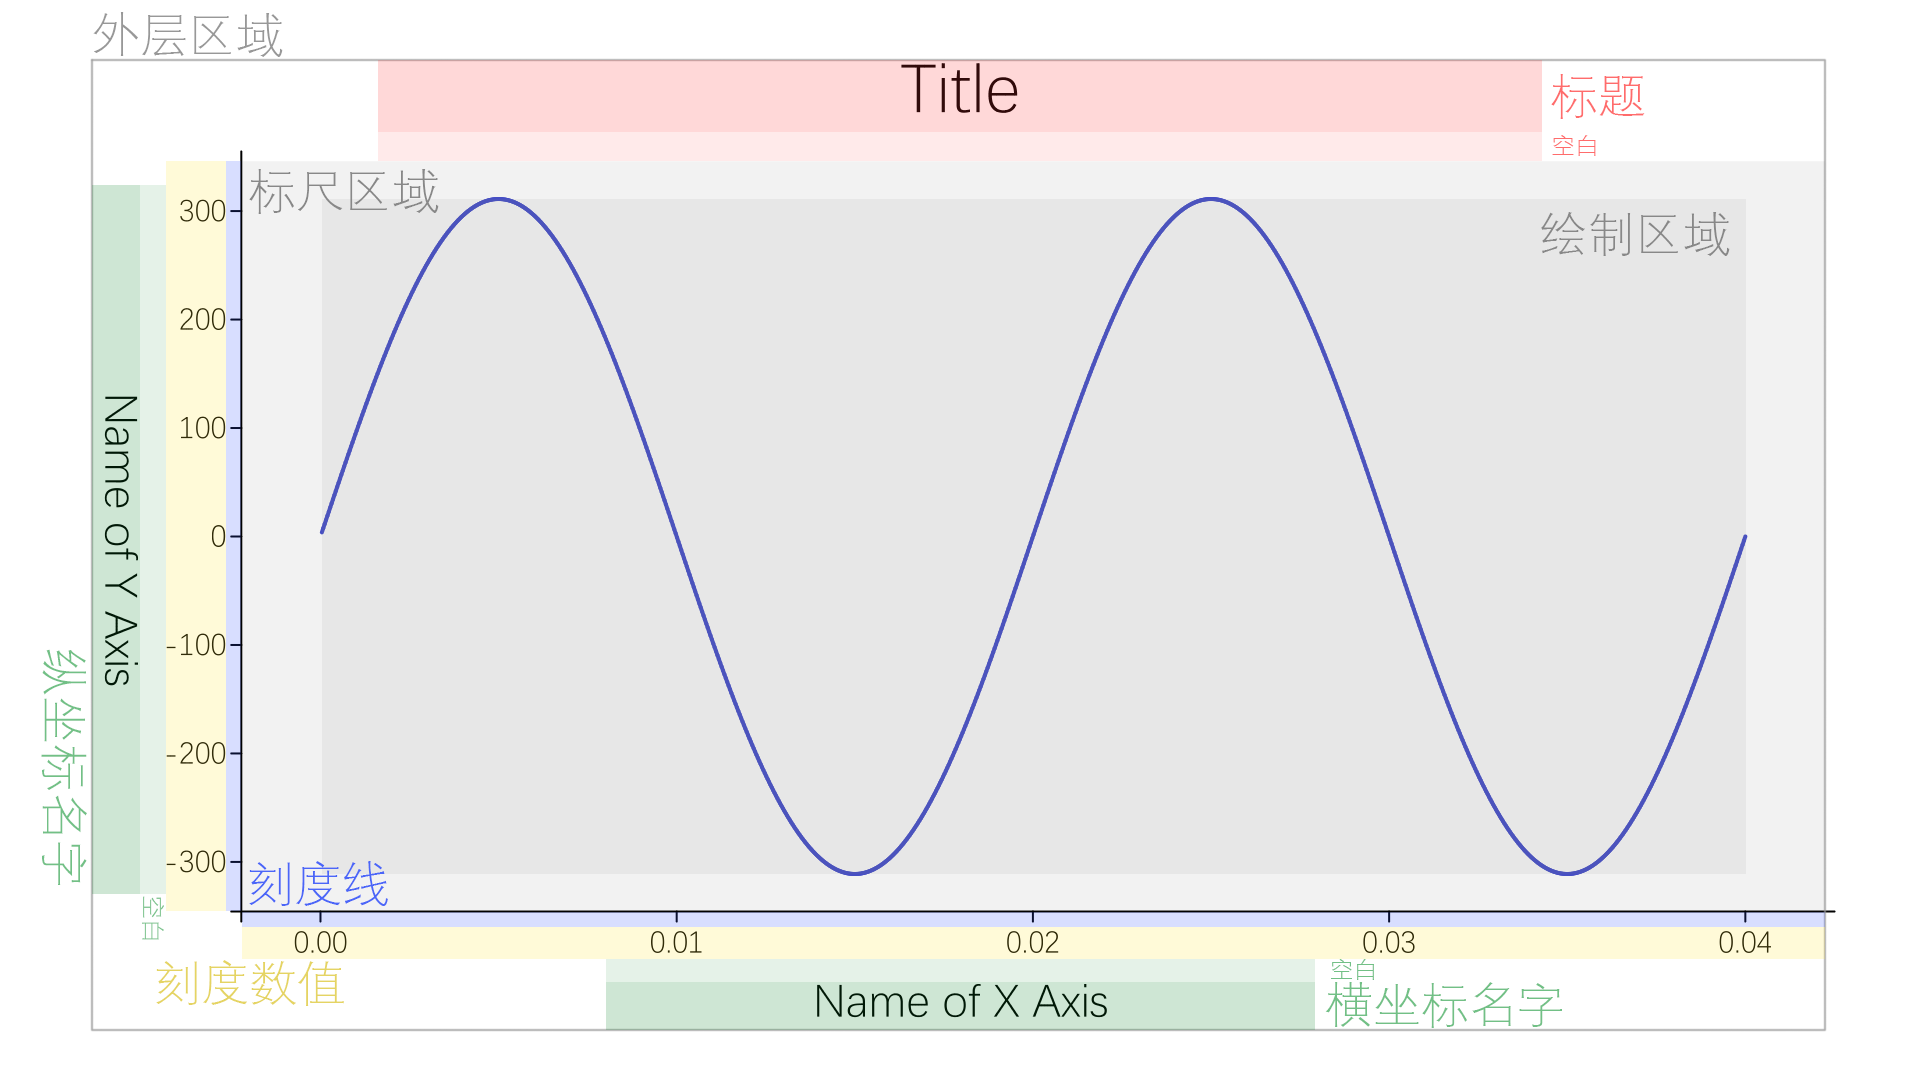
例如我们不使用横纵轴的名称,对应的布局如下:
映射
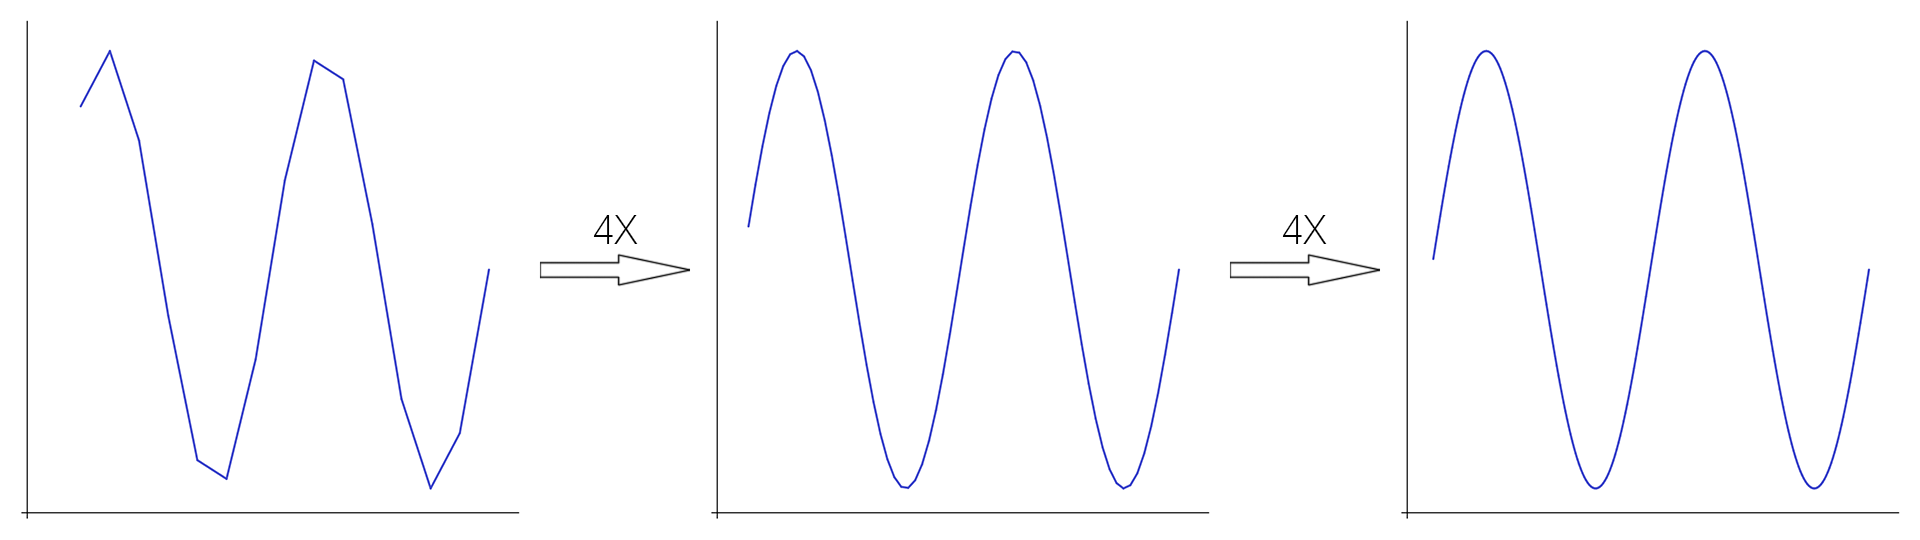
为了实现上文中提到的另一个问题——只绘制函数有意义的部分,我们要根据函数的值域和定义域来确定函数的xy坐标与图片的像素坐标之间的对应关系,来使得最终函数图像区域能够集中绘制有意义的图像。这本质上就是求两个一维的线性映射,一个将定义域映射到绘制区域的宽度上,另一个将值域映射到绘制区域的高度上。这是很容易的。
我们令这个映射为 $f:x\rightarrow x$,其中:
\[x'=sx+d\]为了求这个映射,我们需要两个确定的对应关系。在这里就是定义域(值域)的上下限与绘制区域的边界坐标的对应关系:
\[\begin{gather} f(x_{min})=x'_{min}\quad f(x_{max})=x'_{max}\\ \Rightarrow\left\{\begin{split} &sx_{min}+d=x'_{min}\\ &sx_{max}+d=x'_{max} \end{split}\right.\\ \Rightarrow\left\{\begin{split} &s=\frac{x'_{max}-x'_{min}}{x_{max}-x_{min}}\\ &d=\frac{x_{max}x'_{min}-x_{min}x'_{max}}{x_{max}-x_{min}} \end{split}\right. \end{gather}\]按此公式的指引,我们就能够将函数有意义的部分映射到绘制区域里了。
刻度与文字
刻度的生成就非常的容易且随意,你可以根据定义域(值域)的宽度,用你认为合适的方法获得刻度的间隔,再利用整除等方式获得一列需要标注的数值,最后利用上面的映射来获取它在轴上的坐标,绘制即可。
标注刻度的数值需要将浮点型转化为字符串,这可以使用std::stringstream来轻松完成,还能够像std::cout一样设置保留小数与科学计数法。
注意,布局中的纵轴刻度数值区域的宽度,也应该用每个刻度的数值对应的文字在图中的长度的最大值来计算。使用固定数值不会产生很好的效果.
其他的标题、横纵轴的名称的绘制,主要是要求对齐和居中,利用上一节中锚点在插入图中的比例位置这个参数,可以轻松搞定。
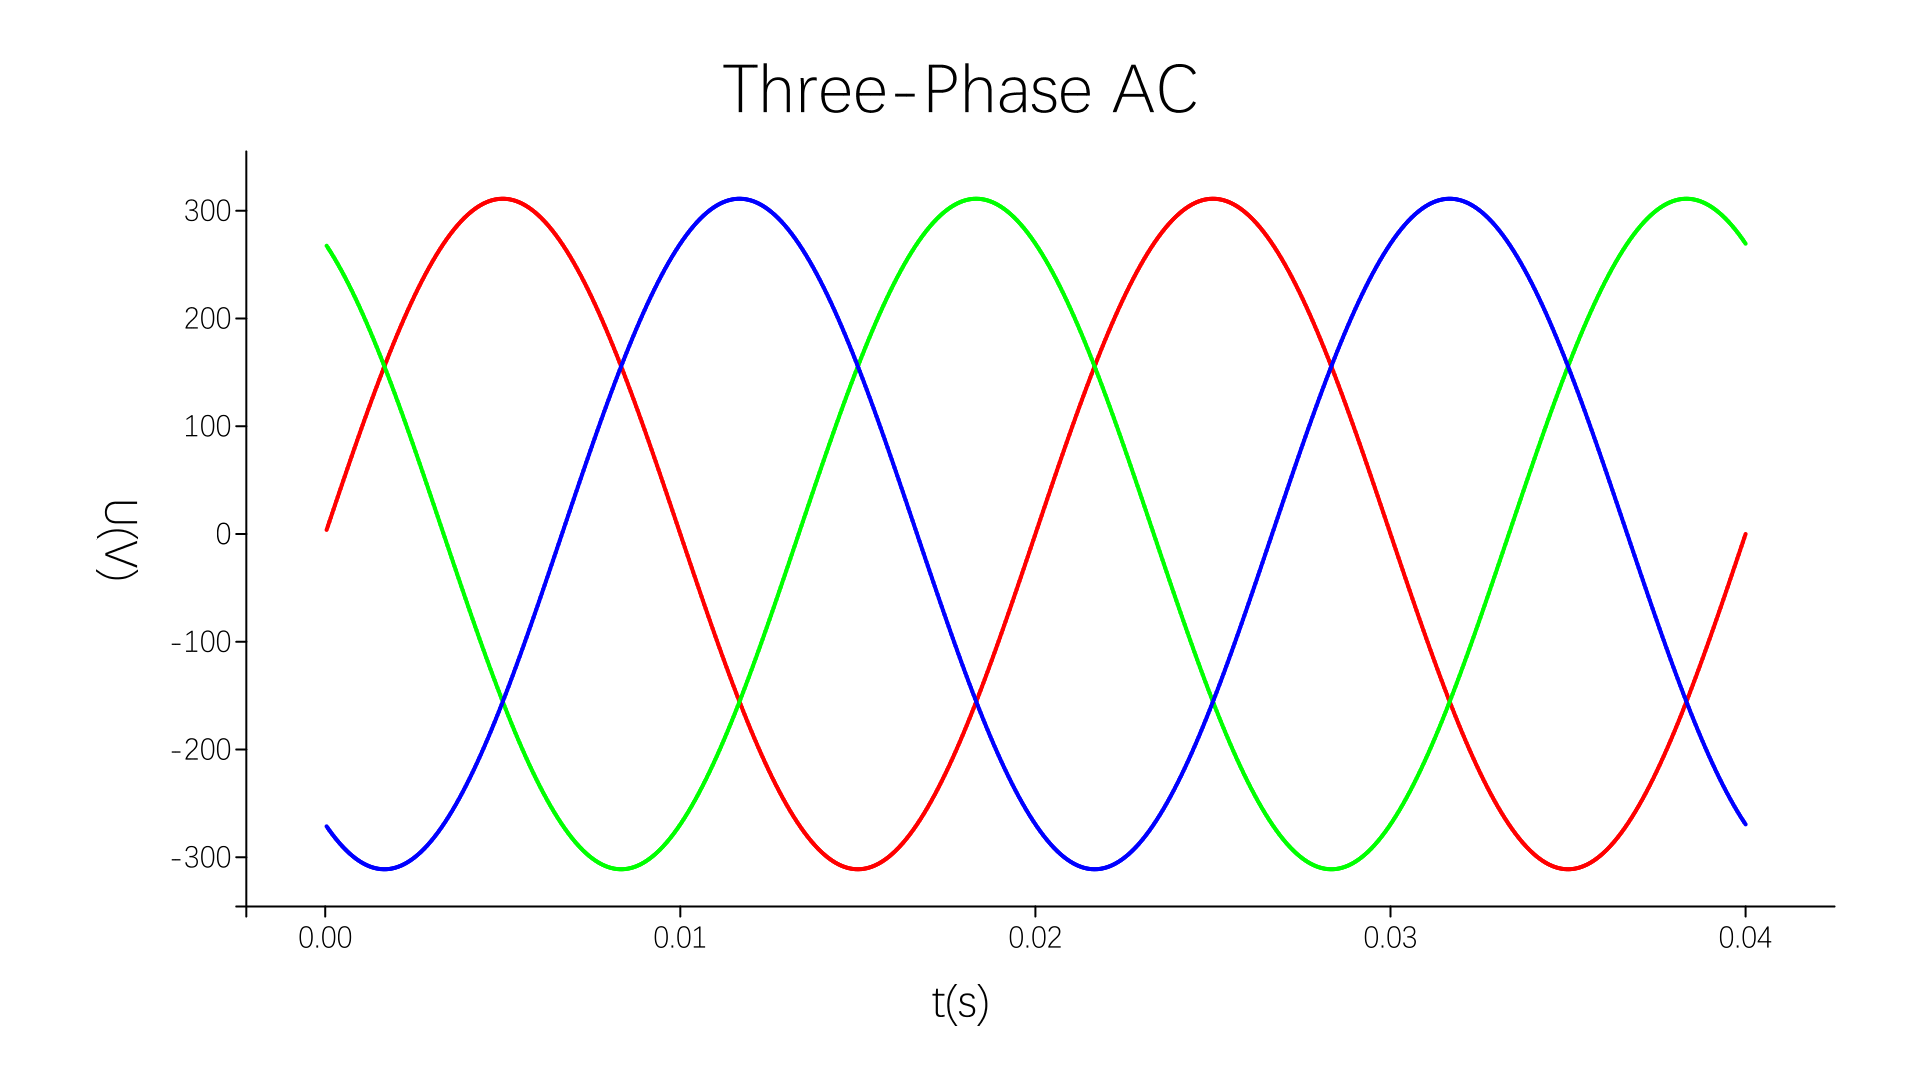
最终成果:
代码
class Plot
{
    public:
        enum ERROR { FONT_NOT_SET };

        //图表上的文字标签
        typedef struct
        {
            char* text;
            Color color;
            Font* font;
            double height;
        } Lable;

        //连续数据
        typedef struct
        {
            function<double(double)> func;
            Color color;
            double lineWidth;
        } Continuous;

        //离散数据
        typedef struct
        {
            double* data;
            Color color;
            double lineWidth;
        } Discrete;

    private:
        static const int defTitleH = 72;
        static const int defNameH = 48;
        static const int defNumberH = 32;
        static const int defWidth = 1920;
        static const int defHeight = 1080;

        int width;
        int height;

        Lable title;                //图表标题
        Lable verName;              //纵轴名字
        Lable horName;              //横轴名字

        Color rulerColor;           //标尺颜色
        Font* rulerFont;            //标尺字体
        double rulerHeight;         //标尺字体高度
        bool verScaleEnabled;       //显示刻度
        bool horScaleEnabled;
        bool verNumberEnabled;      //显示数字
        bool horNumberEnabled;

        Font* defFont;              //默认字体

        //核心函数,负责利用离散数据点绘制图像
        void plotRaw(Image& image, vector<Discrete> data, int points, double xMin, double xMax)
        {
            if (defFont == NULL)
            {
                cerr << "ERROR | Plot::plotRaw(Image&, vector<Discrete>, int, double, double) : Default font not set.\n";
                throw FONT_NOT_SET;
            }

            //初始化字体
            if (!title.font) title.font = defFont;
            if (!verName.font) verName.font = defFont;
            if (!horName.font) horName.font = defFont;
            if (!rulerFont) rulerFont = defFont;

            //获取极值、极值差(最小2e-6)
            double yMax = data[0].data[0], yMin = yMax;
            for (size_t i = 0; i < data.size(); i++)
            {
                for (int j = 1; j < points; j++)
                {
                    yMax = max(yMax, data[i].data[j]);
                    yMin = min(yMin, data[i].data[j]);
                }
            }
            if (yMax - yMin < 2e-6)
            {
                yMax += 1e-6;
                yMin -= 1e-6;
            }

            int om ;            //数量级
            double step;        //刻度间隔
            double pos;         //刻度像素位置
            stringstream str;   //刻度数值缓冲区

            //计算纵轴刻度数值区域宽度
            double verNumW = 0;
            if (verScaleEnabled && verNumberEnabled)
            {
                om = round(log10(yMax - yMin) - 1);     //数量级
                step = pow(10, om);                     //标注间隔
                //计算最大的刻度数值宽度作为区域宽度
                for (int y = round(yMin / step); y <= round(yMax / step); y++)
                {
                    str << fixed << setprecision(-om > 0 ? -om : 0) << y * step;
                    verNumW = max(rulerFont->stringWidth(str.str(), rulerHeight), verNumW);
                    str.str("");
                }
            }

            //计算横轴刻度数值区域宽度
            double horNumW = (horScaleEnabled && horNumberEnabled) ? rulerHeight : 0;

            //计算刻度线宽度
            double verSclW = verScaleEnabled ? 15 : 0;
            double horSclW = horScaleEnabled ? 15 : 0;

            //计算文字标签宽度
            double titleW = title.text ? 1.5 * title.height : 0;
            double verNameW = verName.text ? 1.5 * verName.height : 0;
            double horNameW = horName.text ? 1.5 * horName.height : 0;

            //设置外层区域参数
            double outXMin = max(25.0, 0.05 * image.getWidth());
            double outXMax = image.getWidth() - outXMin;
            double outYMin = max(25.0, 0.05 * image.getHeight());
            double outYMax = image.getHeight() - outYMin;

            //设置标尺区域参数
            double rulerXMin = outXMin + verNameW + verNumW + verSclW;
            double rulerXMax = outXMax;
            double rulerYMin = outYMin + horNameW + horNumW + horSclW;
            double rulerYMax = outYMax - titleW;

            //设置绘制区域参数
            double plotXMin = rulerXMin + 0.05 * (rulerXMax - rulerXMin);
            double plotXMax = rulerXMax - 0.05 * (rulerXMax - rulerXMin);
            double plotYMin = rulerYMin + 0.05 * (rulerYMax - rulerYMin);
            double plotYMax = rulerYMax - 0.05 * (rulerYMax - rulerYMin);

            //创建函数值到像素位置的映射(x' = s * x + d)
            double ys, yd, xs, xd;
            ys = (plotYMax - plotYMin) / (yMax - yMin);
            yd = -ys * yMin + plotYMin;
            xs = (plotXMax - plotXMin) / (xMax - xMin);
            xd = -xs * xMin + plotXMin;

            //准备工作
            Capsule* cap;       //直线对象
            Figure::Attribute rulerAttr = { rulerColor, 0, -1 };
            image.setBackgroundColor({ 0, 0, 0, 0 });

            //画坐标轴
            cap = new Capsule({ rulerXMin - 10, rulerYMin }, { rulerXMax + 10, rulerYMin }, 1, rulerAttr);
            image.draw(*cap);
            delete cap;
            cap = new Capsule({ rulerXMin, rulerYMin - 10 }, { rulerXMin, rulerYMax + 10 }, 1, rulerAttr);
            image.draw(*cap);
            delete cap;

            //数值标注
            if (verScaleEnabled)
            {
                om = round(log10(yMax - yMin) - 1);     //数量级
                step = pow(10, om);                     //标注间隔
                for (int y = floor(yMin / step); y <= ceil(yMax / step); y++)
                {
                    pos = ys * y * step + yd;           //计算刻度的图上坐标
                    if (pos > rulerYMin && pos < rulerYMax)
                    {
                        //绘制刻度线
                        cap = new Capsule({ rulerXMin, pos }, { rulerXMin - 10, pos }, 1, rulerAttr);
                        image.draw(*cap);
                        delete cap;
                        if (verNumberEnabled)
                        {
                            //绘制刻度数值
                            str << fixed << setprecision(-om > 0 ? -om : 0) << y * step;
                            image.addText(str.str(), { rulerXMin - 15, pos }, { 1, 0.5 }, rulerHeight, 0, *rulerFont, rulerColor);
                            str.str("");
                        }
                    }
                }
            }
            if (horScaleEnabled)
            {
                om = round(log10(xMax - xMin) - 1);
                step = pow(10, om);
                for (int x = floor(xMin / step); x <= ceil(xMax / step); x++)
                {
                    pos = xs * x * step + xd;
                    if (pos > rulerXMin && pos < rulerXMax)
                    {
                        cap = new Capsule({ pos, rulerYMin }, { pos, rulerYMin - 10 }, 1, rulerAttr);
                        image.draw(*cap);
                        delete cap;
                        if (horNumberEnabled)
                        {
                            str << fixed << setprecision(-om > 0 ? -om : 0) << x * step;
                            image.addText(str.str(), { pos, rulerYMin - 15 }, { 0.5, 1 }, rulerHeight, 0, *rulerFont, rulerColor);
                            str.str("");
                        }
                    }
                }
            }

            //画标签
            if (title.text)
                image.addText(title.text, { width / 2.0, outYMax }, { 0.5, 1 }/*水平居中,顶部对齐*/, title.height, 0, *title.font, title.color);
            if (verName.text)
                image.addText(verName.text, { outXMin, height / 2.0 }, { 0.5, 0 }/*水平居中,底部对齐*/, verName.height, -90, *verName.font, verName.color);
            if (horName.text)
                image.addText(horName.text, { width / 2.0, outYMin }, { 0.5, 0 }/*水平居中,底部对齐*/, horName.height, 0, *horName.font, horName.color);

            //画折线图
            double x1, y1, x2, y2;
            for (size_t i = 0; i < data.size(); i++)
            {
                Figure::Attribute funcAttr = { data[i].color, 0, -1 };
                double lwidth = data[i].lineWidth / 2;
                for (int j = 1; j < points - 1; j++)
                {
                    //计算函数上的坐标对应在图中的坐标
                    x1 = plotXMin + j * (plotXMax - plotXMin) / (points - 1);
                    y1 = ys * data[i].data[j] + yd;
                    x2 = plotXMin + (j + 1) * (plotXMax - plotXMin) / (points - 1);
                    y2 = ys * data[i].data[j + 1] + yd;
                    //连接一条直线
                    cap = new Capsule({ x1, y1 }, { x2, y2 }, lwidth, funcAttr);
                    image.draw(*cap);
                    delete cap;
                }
            }
        }

    public:
        Plot() :
            width(defWidth), height(defHeight), defFont(NULL),
            title({ NULL, { 0, 0, 0 }, NULL, defTitleH }),
            verName({ NULL, { 0, 0, 0 }, NULL, defNameH }),
            horName({ NULL, { 0, 0, 0 }, NULL, defNameH }),
            rulerColor(0, 0, 0), rulerHeight(defNumberH), rulerFont(NULL),
            verScaleEnabled(true), horScaleEnabled(true),
            verNumberEnabled(true), horNumberEnabled(true) {}

        ~Plot() {}

        //设置输出尺寸
        void setSize(int w, int h) { width = w; height = h; }

        //设置默认字体
        void setDefaultFont(Font& font) { defFont = &font; }

        //设置标题
        void setTitle(const char* text, Color color = { 0, 0, 0 }, double height = defTitleH, Font* font = NULL)
        { title.text = (char*)text; title.color = color; title.height = height; title.font = font; }

        //设置纵轴名字
        void setVerName(const char* text, Color color = { 0, 0, 0 }, double height = defNameH, Font* font = NULL)
        { verName.text = (char*)text; verName.color = color; verName.height = height; verName.font = font; }

        //设置横轴名字
        void setHorName(const char* text, Color color = { 0, 0, 0 }, double height = defNameH, Font* font = NULL)
        { horName.text = (char*)text; horName.color = color; horName.height = height; horName.font = font; }

        //设置标尺
        void setRuler(Color color = { 0, 0, 0 }, double height = defNumberH, Font* font = NULL)
        { rulerColor = color; rulerHeight = height; rulerFont = font; }

        //设置纵轴刻度显示
        void setVerScaleEnabled(bool enabled) { verScaleEnabled = enabled; }

        //设置横轴刻度显示
        void setHorScaleEnabled(bool enabled) { horScaleEnabled = enabled; }

        //设置纵轴数字显示
        void setVerNumberEnabled(bool enabled) { verNumberEnabled = enabled; }

        //设置横轴数字显示
        void setHorNumberEnabled(bool enabled) { horNumberEnabled = enabled; }

        //画函数
        Image plot(double xMin, double xMax, int points, vector<Continuous> funcs)
        {
            //生成散点数据
            vector<Discrete> disc(funcs.size());
            for (size_t i = 0; i < funcs.size(); i++)
            {
                double* data = new double[points];
                for (int j = 0; j < points; j++)
                {
                    data[j] = funcs[i].func(xMin + (double)(xMax - xMin) * j / (points - 1));
                }
                disc[i] = { data, funcs[i].color, funcs[i].lineWidth };
            }

            //绘制折线图
            Image image(width, height);
            plotRaw(image, disc, points, xMin, xMax);
            for (size_t i = 0; i < disc.size(); i++)
            {
                delete[] disc[i].data;
            }
            return image;
        }

        //画离散数据
        Image plot(int points, vector<Discrete> data)
        {
            Image image(width, height);
            plotRaw(image, data, points, 0, points);
            return image;
        }
};
也可以查看:🔗Github: JeffreyXiang/DrawWithCpp
总结
在本节中,我们分部解析了怎样利用现有的基础功能——图像的读取和输出,基本图形的绘制,图像的变换(平移、旋转、缩放)和文字的插入等——来实现我们的第一个应用小程序之函数图像绘制,成果颇丰,非常令人满意。
绘图工具 get!! Origin可以圆润的离开啦!
预告
也许真的要讲搁置已久的构造实体几何(CSG)了?无奖竞猜:我上次预告这一节是在哪篇文章?(/▽\)